Synced spend
$1784.30
Feb 2026 - Jul 2026
Public product walkthrough
One calm place to see AI spend, usage, and budget drift.
A personal operations dashboard that turns provider-level API reports into a unified view for day-to-day cost decisions.
Product preview
The dashboard keeps cost summary, provider mix, budget guardrails, and model-level trends in one workspace.
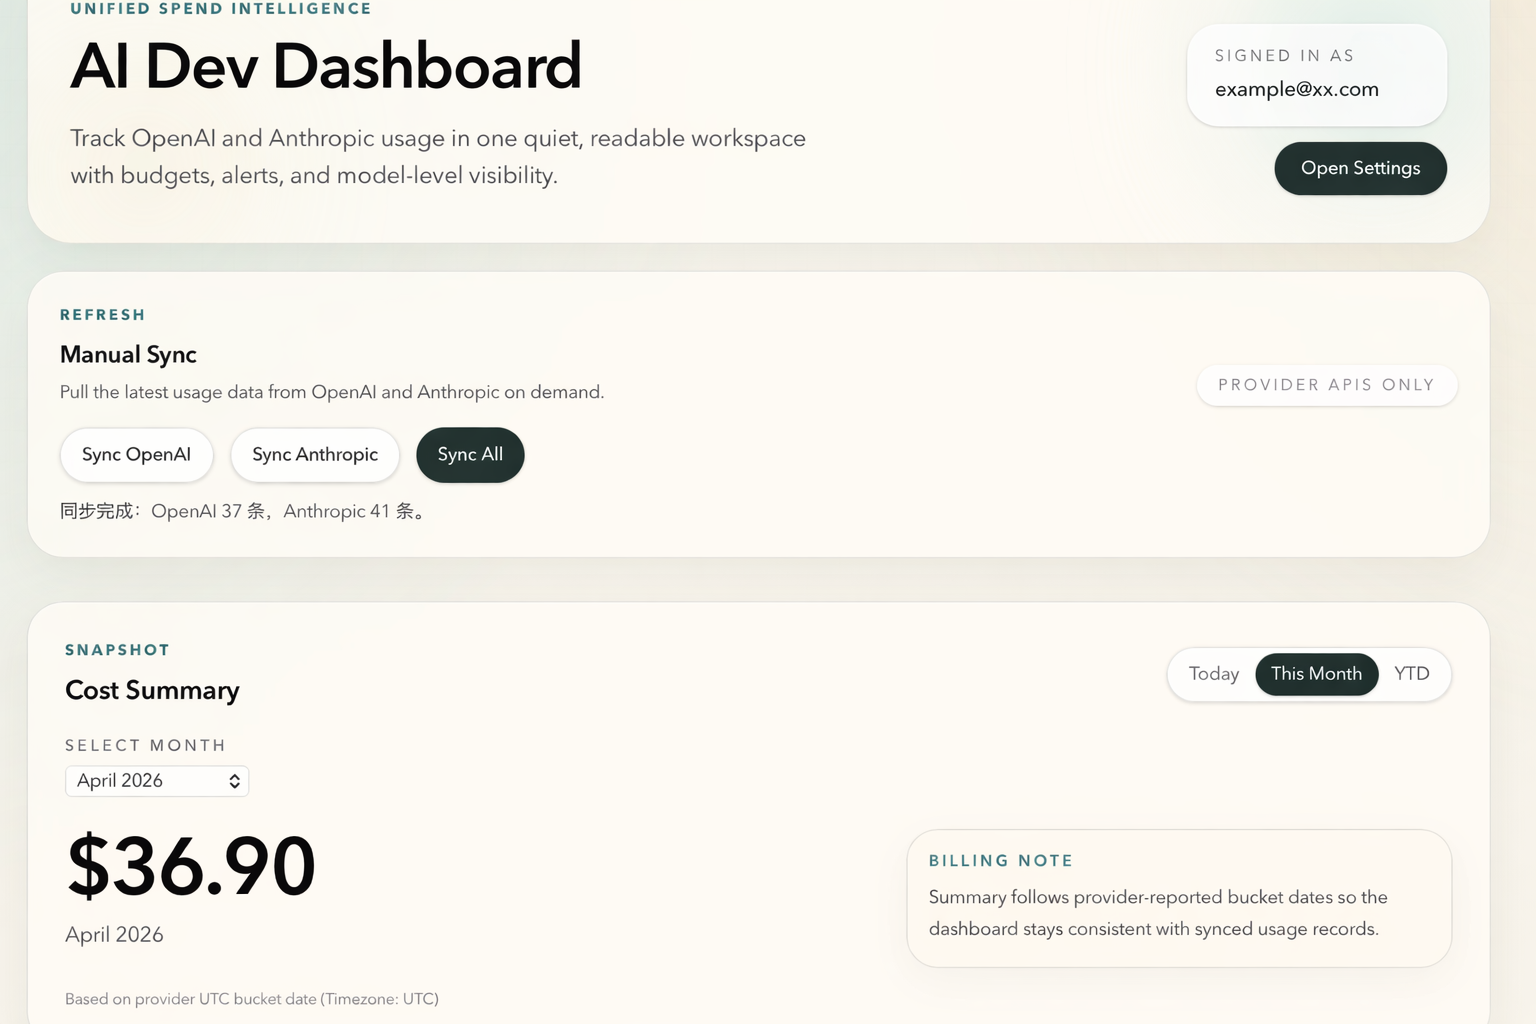
Published Jul 9, 2026 · Public view uses aggregated data only.
Snapshot
Numbers are sourced from the latest public aggregate snapshot, never from raw usage rows.
Synced spend
$1784.30
Feb 2026 - Jul 2026
Token volume
878.5M
Input + output tokens
Providers tracked
2
Anthropic + OpenAI
Model families
3
Normalized for comparison
Live shape of the product
A compact view of the signals the dashboard brings together for day-to-day AI spend decisions.
Trend
Provider spend over the selected window.
Mix
Normalized model families ranked by total spend.
What this demonstrates
The project is small enough to understand end to end, with the important production concerns kept visible in the implementation.
Data pipeline
OpenAI and Anthropic usage are normalized into one readable cost and token view.
Shared provider normalization keeps comparisons consistent.
Data boundary
PostgreSQL Row Level Security keeps private records scoped to the signed-in account.
The public page reads only a curated aggregate snapshot.
Credential handling
Provider credentials are encrypted server-side and never returned to browser components.
Sync routes decrypt keys only when a provider request runs.
Sync reliability
Repeated syncs upsert normalized records and preserve cost totals without duplicate rows.
Model canonicalization keeps chart labels stable across provider reports.